Residual Plot Practice: Same R², Different Error Patterns
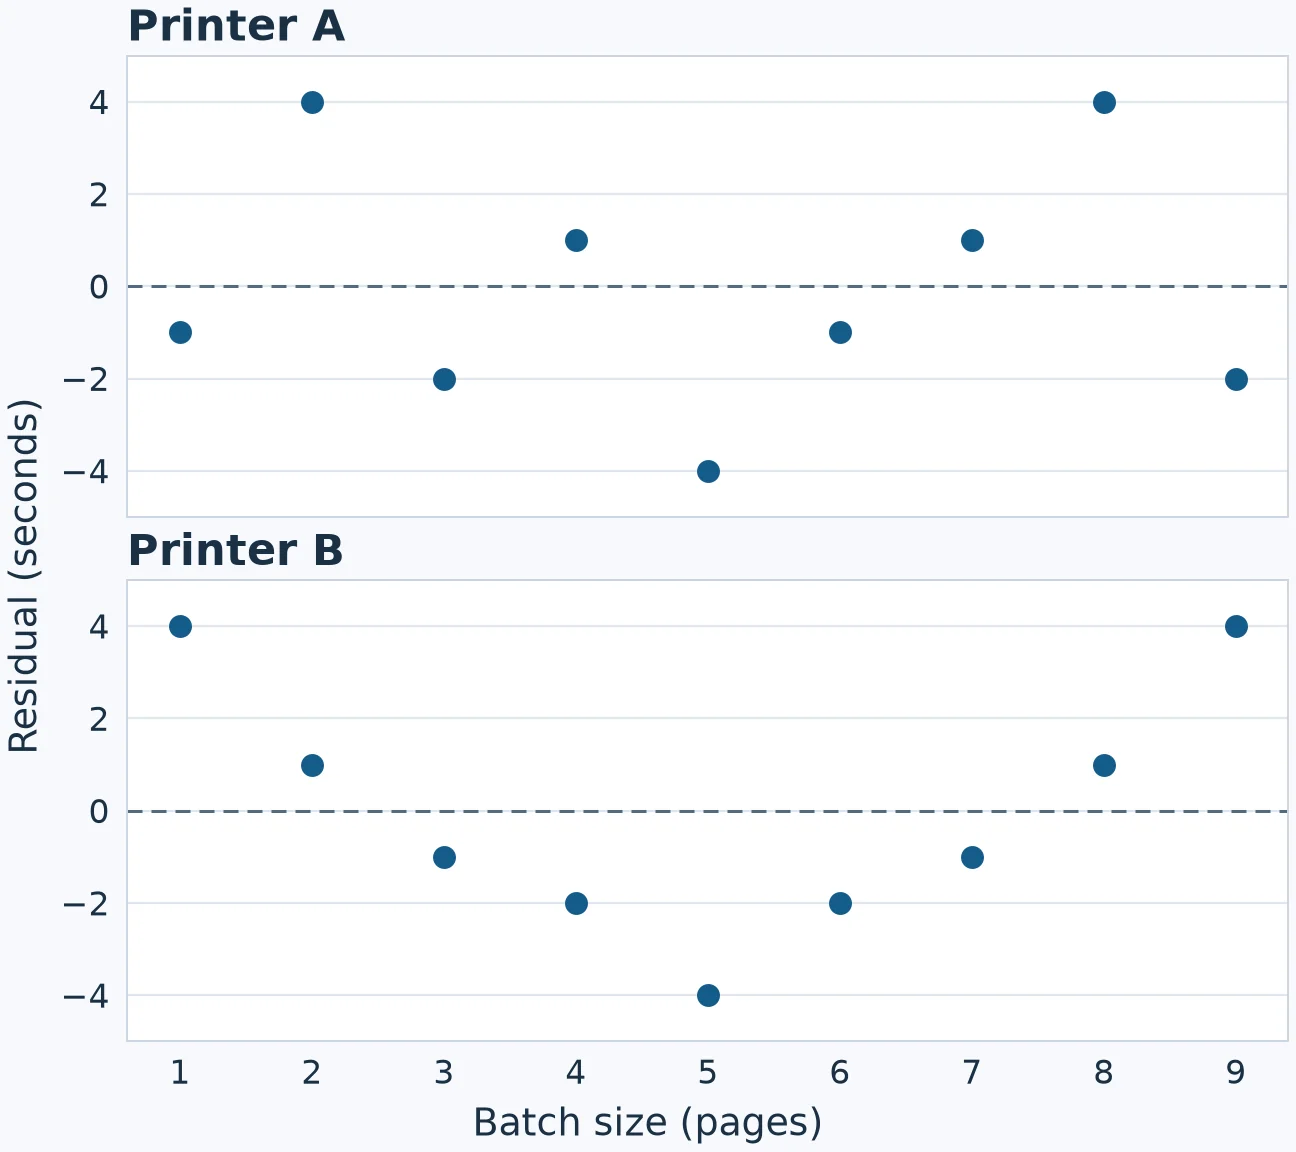
Fit a least-squares line to either of these two sets of invented printing times and you get the same equation and the same R² of 0.90. For printer B, the line predicts too little time for the smallest and largest batches and too much time for the batches in the middle. You can see that pattern as soon as you plot the residuals.
A residual is the observed value minus the predicted value. It has the same units as the response, so these residuals are in seconds. A positive residual means the model underpredicted. A negative residual means it overpredicted. Zero means the observed time matched the prediction. NIST's guide to assessing model fit

Calculate a residual for one batch
Each printer has one time for each batch size from 1 to 9 pages. Fit the datasets separately and both give ŷ = 12 + 3x, where x is the number of pages and ŷ is the predicted printing time in seconds.
For a one-page batch, the model predicts 12 + 3 × 1 = 15 seconds. Printer B took 19 seconds, so its residual is 19 − 15 = +4 seconds. The line predicts four seconds too little. Printer A took 14 seconds, giving a residual of 14 − 15 = −1 second. The same line predicts one second too much for that batch.
Read the two residual plots
Plot batch size on the horizontal axis and the residual in seconds on the vertical axis. Each point represents one batch. The point at (1, +4) for printer B sits four seconds above the zero line because the batch took four seconds longer than predicted.
| Batch size (pages) | Predicted (s) | A observed (s) | A residual (s) | B observed (s) | B residual (s) |
|---|---|---|---|---|---|
| 1 | 15 | 14 | −1 | 19 | +4 |
| 2 | 18 | 22 | +4 | 19 | +1 |
| 3 | 21 | 19 | −2 | 20 | −1 |
| 4 | 24 | 25 | +1 | 22 | −2 |
| 5 | 27 | 23 | −4 | 23 | −4 |
| 6 | 30 | 29 | −1 | 28 | −2 |
| 7 | 33 | 34 | +1 | 32 | −1 |
| 8 | 36 | 40 | +4 | 37 | +1 |
| 9 | 39 | 37 | −2 | 43 | +4 |
For printer A, the nine points fall above and below zero with no obvious broad pattern. A straight line is a reasonable starting model for the observed batch sizes.
For printer B, the residuals are positive at 1–2 and 8–9 pages and negative at every size from 3 to 7 pages. The line underpredicts at both ends and overpredicts in the middle. That U shape gives you a reason to try a curved model. NIST's guide to using residuals to check model form
When you read a residual plot, look at where the points are centered and how far they spread. In a U shape, the center shifts with batch size. In a funnel that widens around zero, the center stays near zero and the printing times vary more around the fitted line for larger batches. NIST's examples of changing spread
How both fits get the same R-squared
Square the residuals and add them up. You get 60 for each printer. If you use the mean time of 27 seconds as a baseline prediction for every batch, the squared errors add up to 600 for each printer. That gives R² = 1 − 60/600 = 0.90. The fitted line accounts for 90% of the variation in the observed printing times for each printer.
Both printers have a mean residual of zero because the positive and negative residuals balance overall. Plotting individual residuals shows where the line missed and in which direction.
Residual plot practice with answers
Write each answer in terms of printing time. Give the units and direction whenever you calculate a residual.
- A seven-page batch took 34 seconds for A and 32 seconds for B. Use the shared regression line to calculate both residuals and explain what they mean.
- In a separate example, a batch has a predicted time of 32 seconds and a residual of −3 seconds. What was its observed printing time?
- A third residual plot is centered near zero across batch sizes. For small batches, most residuals are within 1 second of zero. For large batches, they spread to about 5 seconds on both sides. What does that shape suggest?
- A classmate says, “Both R² values are 0.90, so I'd trust the straight line equally for both printers.” Which plot gives more support for a straight line over 1–9 pages? Explain using the locations of the misses.
Answer key
- The fitted time is 12 + 3 × 7 = 33 seconds. For A, 34 − 33 = +1 second, so the line predicts one second too little. For B, 32 − 33 = −1 second, so it predicts one second too much.
- Add the residual to the predicted time. The batch took 32 + (−3) = 29 seconds, three seconds less than predicted.
- The wider spread suggests unequal variability in printing time around the fitted line. The residuals are still centered near zero, and the time for a large batch tends to miss the prediction by more than the time for a small batch.
- Printer A gives more support for a straight line because its misses scatter around zero without an obvious broad pattern. For B, the line predicts times that are too short at 1–2 and 8–9 pages and too long at every size from 3 to 7 pages. That pattern suggests trying a curved fit even with R² = 0.90.
Turn a sign mistake into a flashcard
If you mixed up the signs, put “A print job has a residual of +4 seconds. Was the observed printing time longer or shorter than predicted?” on the front of a card. Say the answer before you flip it. The job took four seconds longer than predicted. Try it again tomorrow and a few days later to see if you can still recall the rule without a hint.
For more short prompts, the AP Statistics deck covers residual signs, units, and what a U-shaped plot tells you about a line. AP Statistics flashcards
Residuals are Topic 5.4 in Unit 5, Regression Analysis. College Board's AP Statistics course framework · AP Statistics study plan
Prepared with AI assistance using invented printing times and original exercises. The regression and residual calculations were checked with exact arithmetic.